Bio-Well® · The science, simply
What your scan
is actually reading.
Ten fingertips, one glass plate, under a second each. Here is what the device captures, where the method came from, and everything your report can show you, in plain language.
What it is
Light at the fingertips, read by software
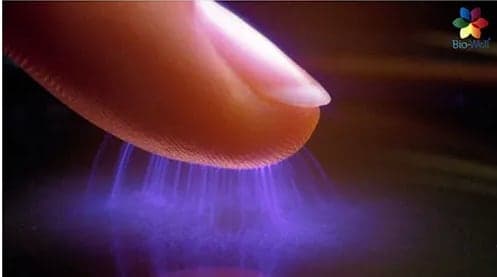
Bio-Well® uses a method called gas discharge visualisation, or GDV. It photographs the faint glow your fingertips give off in response to a gentle stimulus, and turns ten small images into one readable picture of where your energy and stress sit today.
A tiny, safe impulse
Each fingertip rests on a glass plate. For less than a second the device sends a weak, painless electrical impulse through the glass.
The glow is captured
In response, the skin gives off a faint glow of light. A camera inside the device photographs it, one finger at a time.
The software reads it
Each fingertip image is divided into sectors. The software measures the glow, compares it with its reference data and builds the picture you see.
Where it came from
From a glowing photograph to a measured method
1939
Kirlian photography
Semyon and Valentina Kirlian, in Russia, notice that objects placed on photographic film in a high voltage field leave a glowing outline. The images become famous, and contested.
1990s
GDV is developed
Dr. Konstantin Korotkov, a physicist in St Petersburg, turns the idea into a measured, digital method: a camera, a controlled impulse, and software that reads the glow consistently.
Today
Bio-Well®
The current generation of the device, used by practitioners worldwide. Bio-Well describes more than 30 years of research and application behind GDV.
- fingertip images
- 10
- pages in each before and after report
- 40
- energy centres read
- 7
- lifestyle areas estimated
- 6
- vertebrae rows mapped
- 25
What is in your report
Fifteen views of one moment
Every scan produces the same full report. Here is each section in a sentence, shown from Antoinette’s own scan. What it says about you is the part we sit down and talk through.
01
Energy field
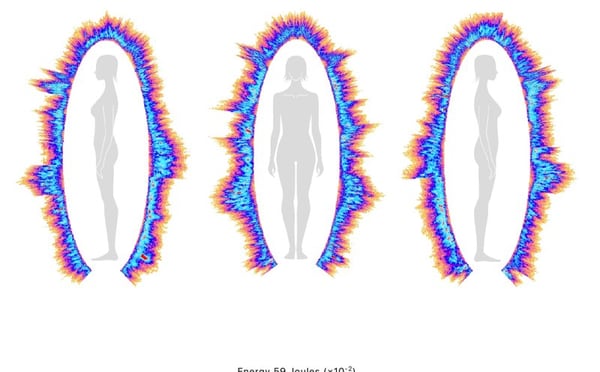
The full body picture, front, left and right. The glowing outline most people recognise.
02
Energy centres
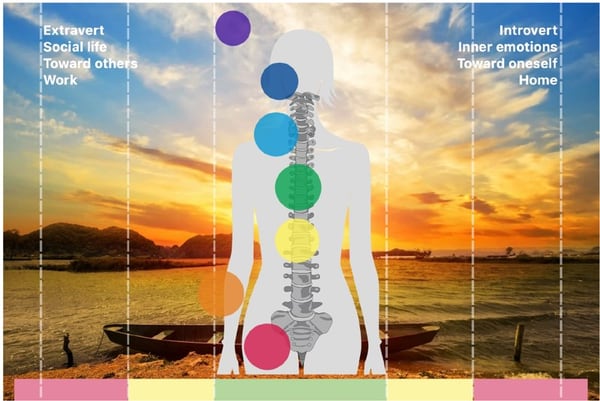
Your seven chakras, read for energy and alignment, side by side.
03
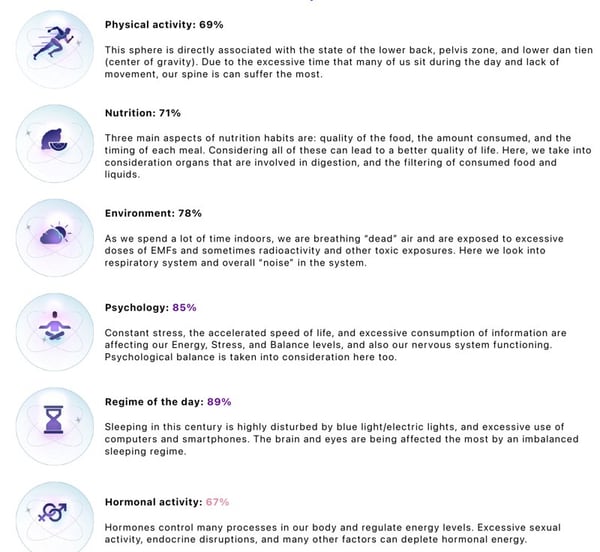
Lifestyle
Six estimates: physical activity, nutrition, environment, psychology, daily rhythm and hormonal activity.
04
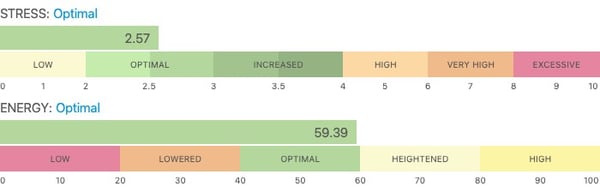
Stress and energy
Two core numbers, each with its own optimal band, so you can see where you sit.

05
Go and rest balance
How evenly your sympathetic and parasympathetic responses are matched, read for each hand.
06
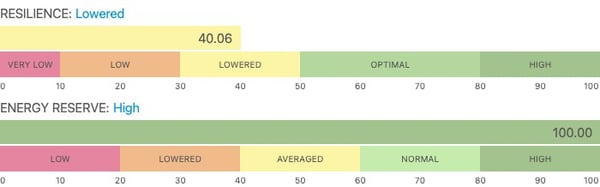
Resilience and reserve
How much capacity you have to recover, and how much is held in reserve.
07
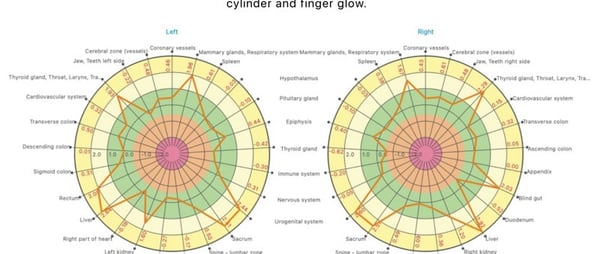
Systems map
The software groups fingertip sectors into body systems and shows their relative energy. A map, never a diagnosis.
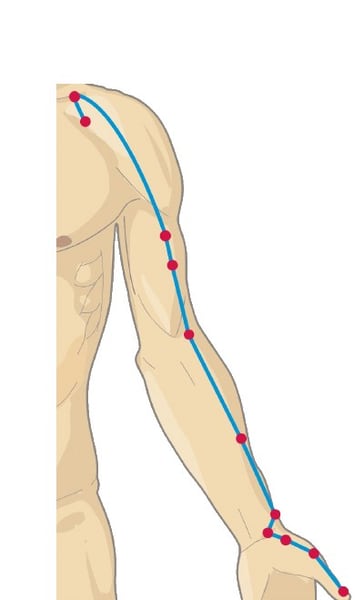
08
Yin and yang
The meridian view from traditional Chinese medicine, shown as balance between left and right.
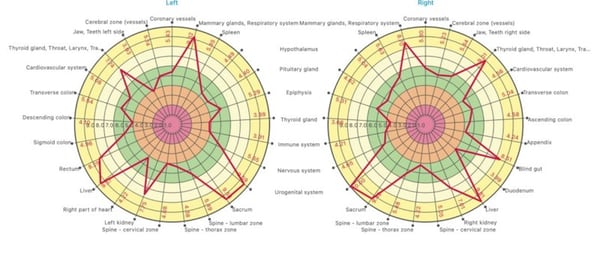
09
Left and right diagrams
Two radar charts that make any difference between your inner and outer sides easy to see.
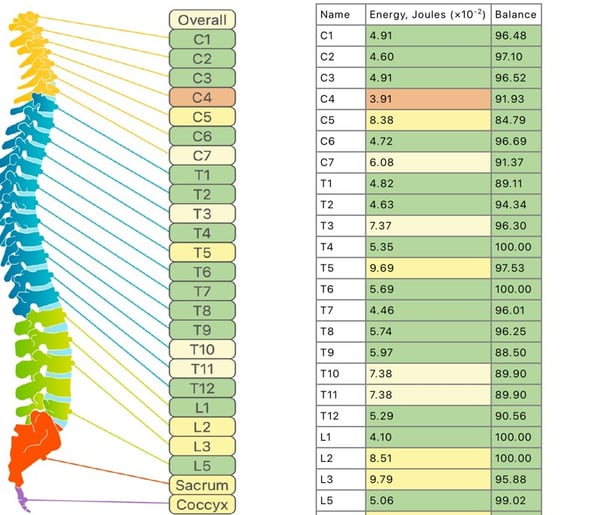
10
Vertebrae
A 25 row table from the neck to the base of the spine, each with an energy and balance reading.
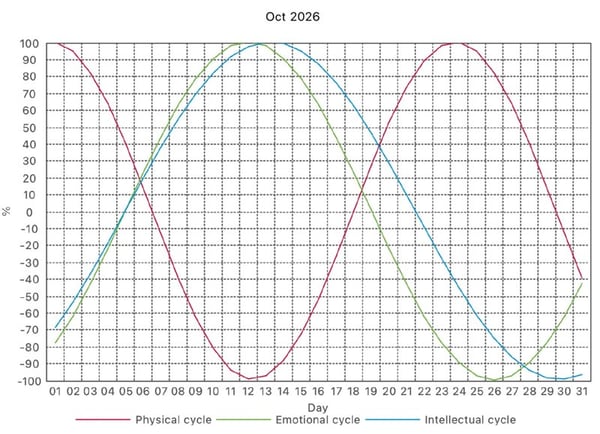
11
Biorhythms
Your readings plotted over time, so a single scan sits inside a bigger story.
12
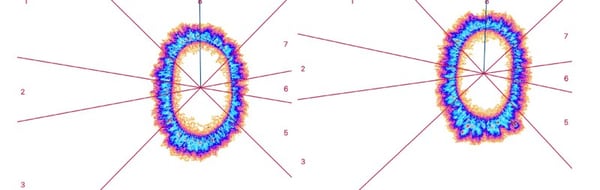
Fingertip images
The ten original glows the whole report is built from.
13
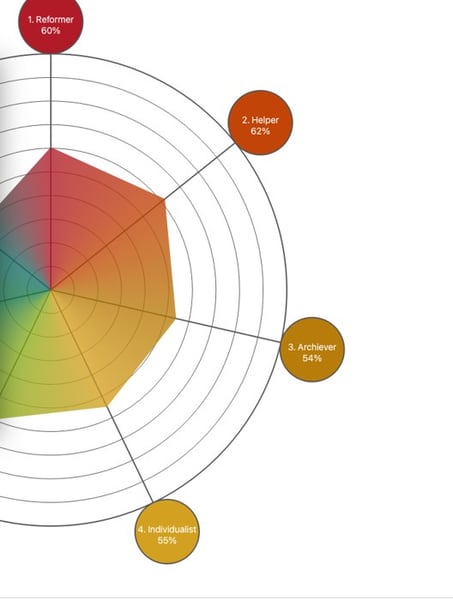
Enneagram
Nine personality patterns, each read as a percentage, so you can see which ones are leading right now.
14
Doshas
The three Ayurvedic energies, Vata, Pitta and Kapha, and how they are balanced in you today.
15
Teeth map
A full map of the teeth, each linked to the body areas and meridians it relates to.
YOUR OWN REPORT
All fifteen views, with your own readings, explained in plain language.
Reading the numbers
Five readings, each on its own scale
Your report marks every reading against a band. The teal band is where most people aim to be. One scan is one moment, so we read it with how you felt that day, never as a verdict.
Stress
0 to 10
Optimal 2 to 3
How hard your system was working to adapt to what was around you. A busy day or a long drive can nudge it.
Energy
Joules
Optimal 40 to 60
How much energy showed up in the glow. Higher is not always better, it can mean well resourced or running hot.
Balance
Left and right hand
Optimal 0 to 1.5
Go mode and rest mode. Your two hands compared. Lower is more even.
Resilience
Percent
Optimal over 50%
How well your system bounces back and keeps moving.
Energy reserve
Percent
Normal 60 to 100%
Whether there was enough in the tank for everything you were doing at that moment.
The spirit lens
Seven energy centres
Each centre shows its energy, with 4 to 6 the optimal range, and how evenly it reads between your two hands. Closer to 100% alignment is more centred. A shifted centre is a question to explore, not an answer.
Root
Stability, safety, grounding
Sacral
Creativity, relationships, home
Solar plexus
Will, responsibility, problem solving
Heart
Connection, empathy, emotional load
Throat
Expression, being heard
Third eye
Clarity, decisions, intuition
Crown
Meaning, purpose, connection
Meridians
The traditional Chinese medicine view
The software also maps your fingertip sectors onto the meridian system and shows yin and yang, left against right. It is one more lens on the same moment, offered as something to explore.
Lifestyle areas
Six parts of daily life
Physical activity, nutrition, environment, psychology, the rhythm of your day and hormonal activity, each estimated from the same readings with its own lower, normal and ideal range. Estimates, not a score on your habits.
Choose your report
As simple or as deep as you want it
Your personalized explainer
Included with the ANSA
Five pages on your own readings, in plain language, with what the scan measured and what it can mean set side by side. Written for you, not for a technician.
Printed explainer
$10 · members $7
The same five page personalized explainer as a physical copy, printed before you leave so you can keep it, mark it up and come back to it.
Full digital report
$50 · members $40
Every page of the Bio-Well® report as a download within 24 hours. Fifteen views, all the numbers, for the people who want everything. Included with a standalone scan.
Every explainer reads like this, science and spirit side by side:
WHAT THE SCAN MEASURED
Only what the report prints, with its own numbers and its own normal ranges.
WHAT IT CAN MEAN
The spirit layer, offered as something to explore, never as a finding.
The detailed report add-on
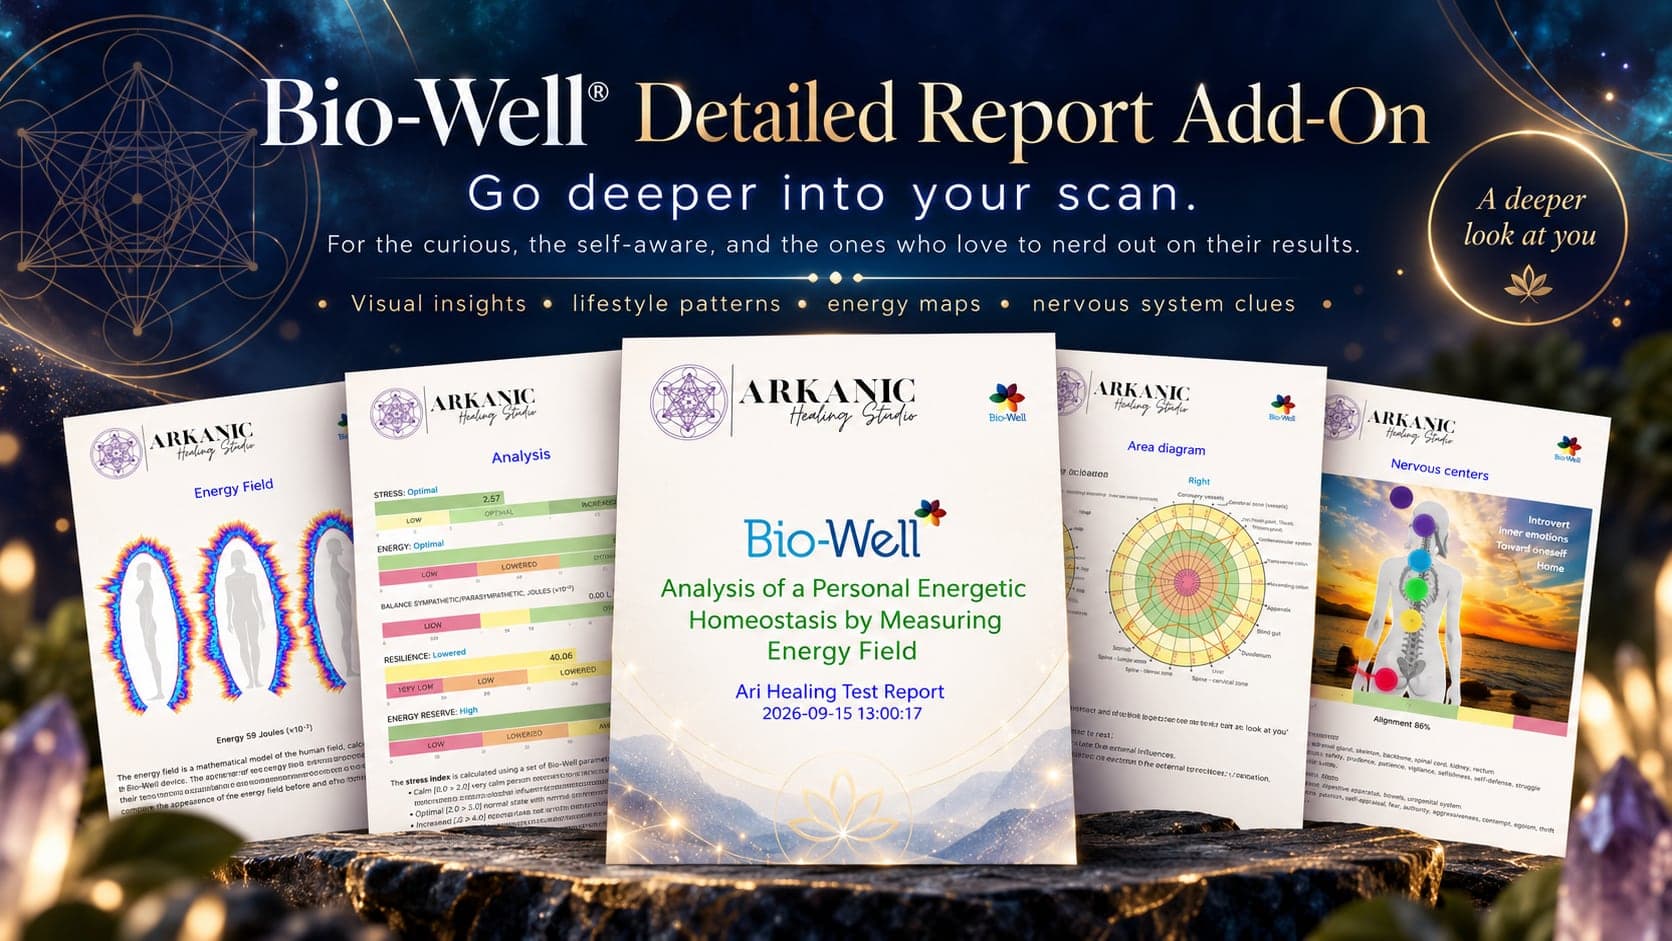
Go deeper into your scan
For the curious, and for anyone who loves to look closely at their own results. Energy field, analysis, area diagrams and your seven centres, laid out page by page.
40 pages
Before report
Your full picture as you arrived.
40 pages
After report
The same views, after your session.
Side by side
Comparison report
What moved, page by page, in one place.
Take it home
Your scan writes the song
Add your Bio-Well® soundtrack and the readings from your scan become a track that is yours alone. Eight to ten minutes long. Listen at home, in the car, before sleep. Emailed within 24 hours.
$20
MEMBERS $15
The next layer
From reading the field to answering it
A scan shows where you are. Bio-Cor® uses those same readings to shape frequency and sound that speak back to your system. Same science, the other direction.
Want the source?
Bio-Well®, in its own words
These are external pages run by Bio-Well®, not by Arkanic. Some of their wording goes further than we do. At Arkanic a scan is a reading of your field at one moment, never a diagnosis.
A Bio-Well® scan is an observational tool. It shows one moment in time, it is not a medical test, and it does not diagnose anything. Arkanic offers non-medical wellness services.